| Date | Price | Ad Spend | Holiday | Clicks |
|---|---|---|---|---|
| 2023-01-01 | 24.99 | 9 | 1 | 2005 |
| 2023-01-02 | 24.99 | 9 | 0 | 894 |
| 2023-01-03 | 24.99 | 9 | 0 | 934 |
| 2023-01-04 | 24.99 | 9 | 0 | 979 |
Using holidays, sales price, and ad spend as predictors for clicks
Summary
In this demonstration, I applied Prophet in R to build a time series forecasting model that predicts daily web traffic to a personalized photo book product page. While commonly treated as a marketing metric, web traffic can serve as a powerful upstream demand signal—with meaningful implications for inventory, revenue, and operational planning.
By incorporating key drivers such as product pricing, monthly ad spend, and seasonal holidays, the model illustrates how external factors shape customer engagement over time. This transparent approach improves forecast accuracy and equips business users with clear insights into the levers that influence demand.
Signal-based forecasting like this enhances scenario planning in the S&OP process. It enables teams to evaluate “what-if” scenarios—such as changes in media spend or price points—before committing resources. The framework also paves the way for forecasting downstream metrics like conversion rates, order volumes, and fulfillment needs, which are especially critical in direct-to-consumer and omnichannel environments where agility and cross-functional alignment are essential.
Objective
Build a daily web traffic forecast using Prophet in R to establish a reliable upstream signal of customer interest and demand potential.
Quantify the impact of promotional timing, ad spend, pricing, and holidays on web traffic patterns to enhance forecast accuracy.
Enable scenario-based forecasting by layering in forward-looking marketing assumptions—helping ensure alignment, visibility, and documentation during the demand review and forecast consensus stages of the S&OP process.
The following shows a preview of the data along with a visual of the complete web traffic trend over time:
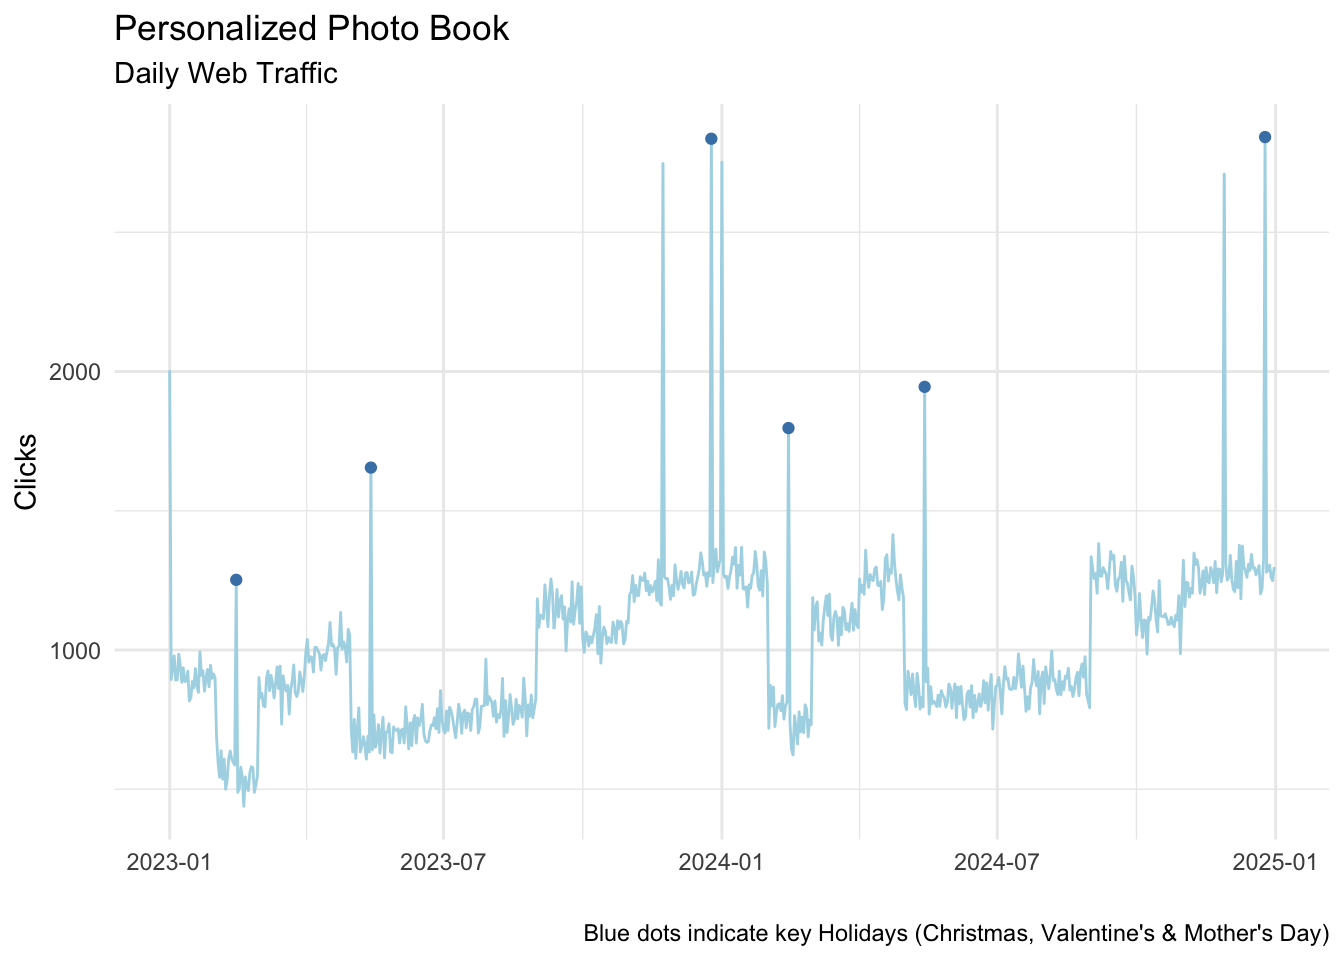
Isolating Key Drivers of Web Traffic
To better understand what influences web traffic, I began by evaluating each business driver—holidays, price, and ad spend—on its own. By testing each variable independently in a simple regression, we gain early insights into how strongly each factor correlates with customer engagement.
The visualizations below highlight the directional relationship and signal strength of each driver, helping us identify which levers are most predictive of traffic patterns before layering them into a more advanced forecasting model.
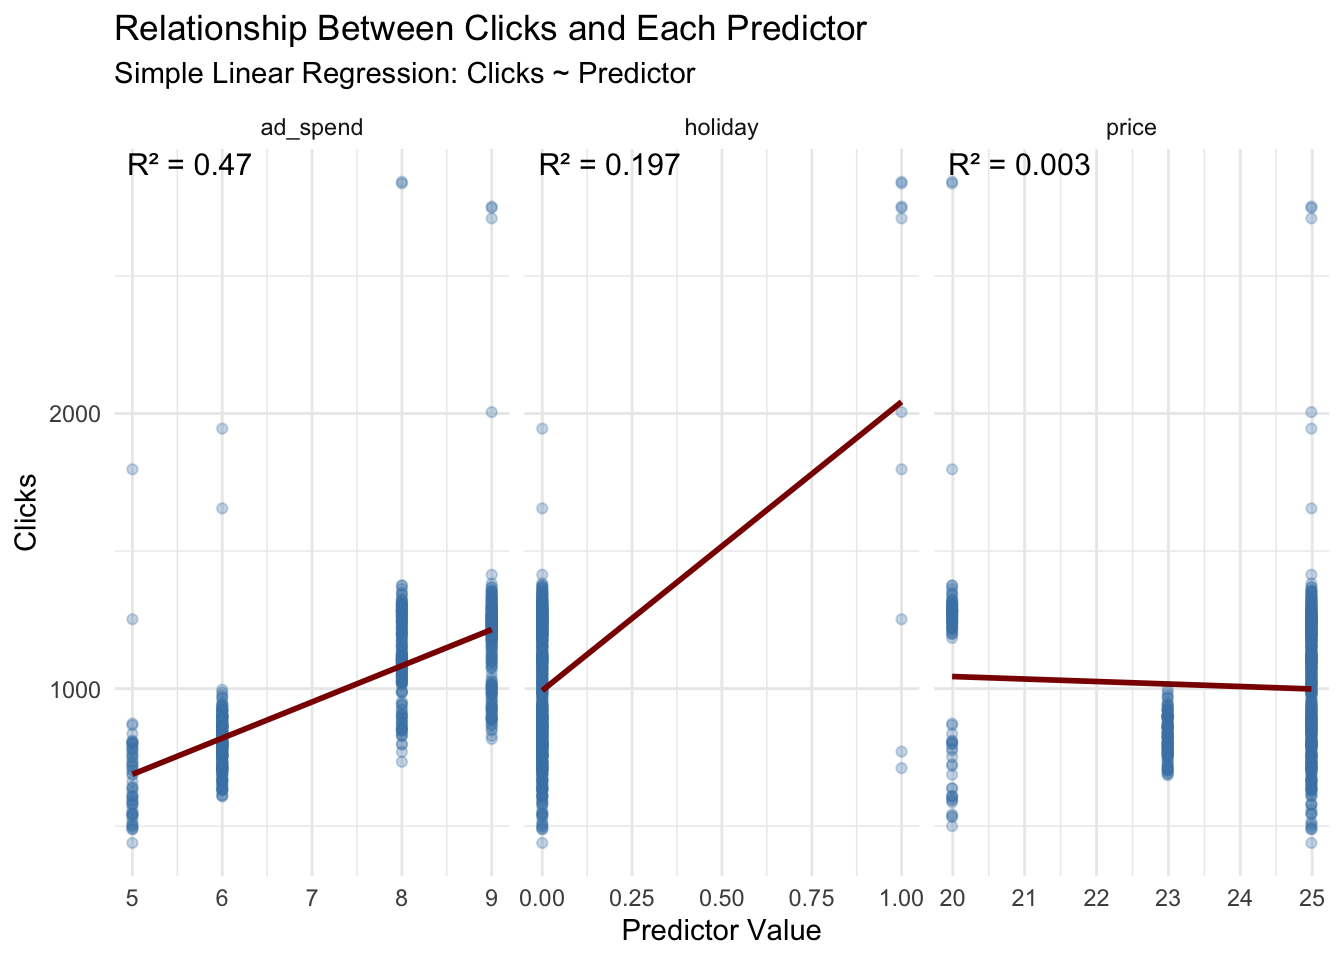
The regression results revealed some useful insights into what drives daily web traffic. Ad spend had a clear, consistent impact on engagement—more investment led to more clicks, reaffirming marketing spend as a dependable traffic lever. While holidays showed only moderate statistical significance, they nearly doubled average daily visits during peak periods. That sharp but infrequent surge highlights the value of well-timed seasonal campaigns. In contrast, price didn’t show much direct influence on click behavior, suggesting that visitors are more responsive to promotional messaging and visibility than to pricing alone.
Building a Baseline Forecast
With a clearer understanding of the individual drivers of web traffic, the next step is to build a baseline forecast model using Prophet. This model leverages historical trends and seasonality to predict future daily clicks without any external inputs. It serves as a starting point to evaluate how much predictive power comes from the data’s natural patterns alone—before layering in business drivers like holidays, price, or ad spend.
Prophet is an open-source library developed by Facebook for forecasting time series data. It’s available in both R and Python. More info can be found here.
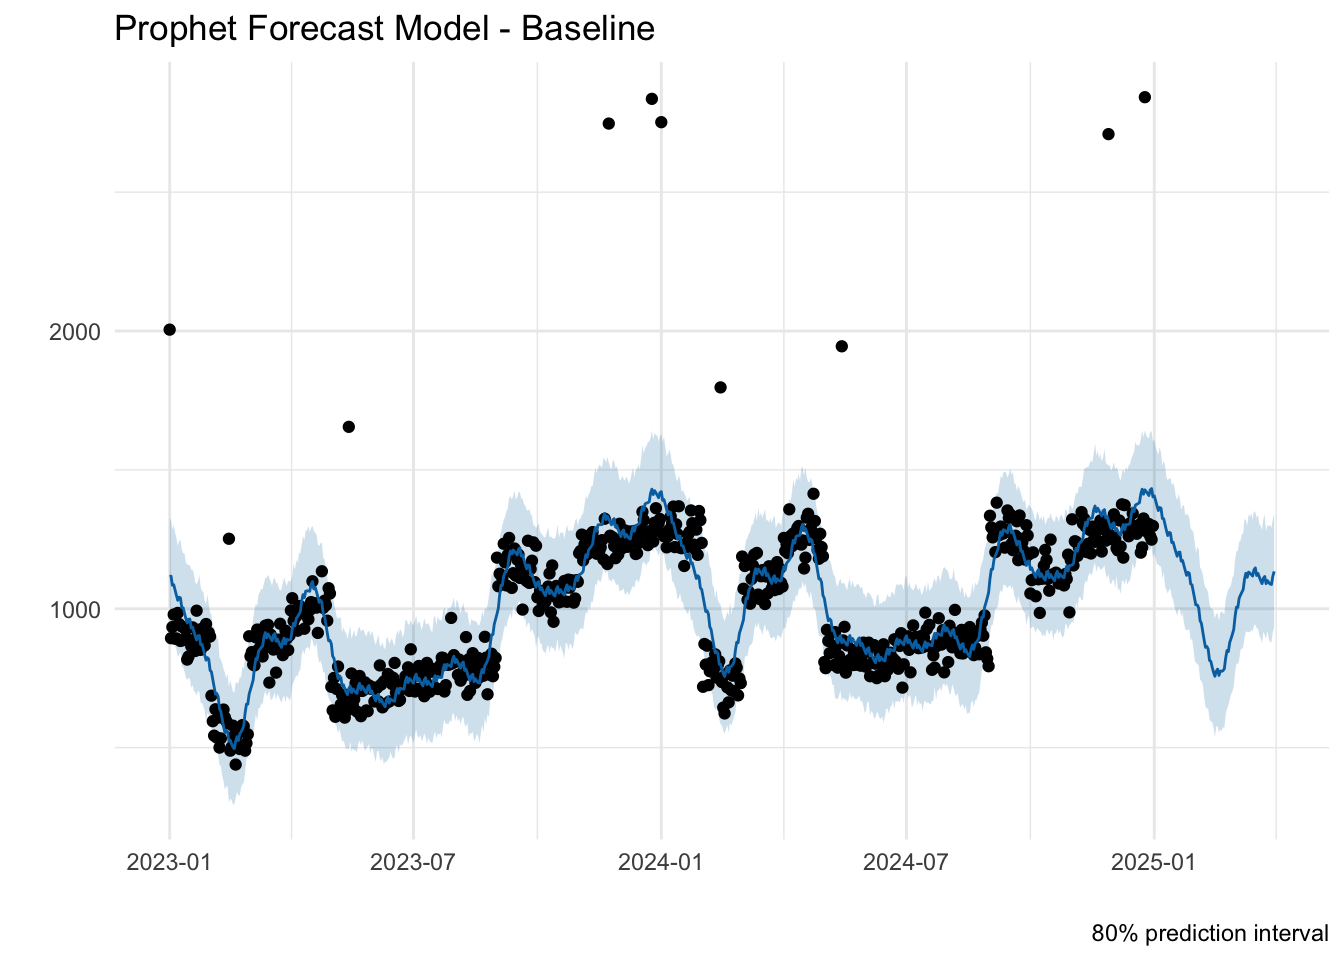
The baseline forecast offers a solid foundation, accurately capturing long-term trends and seasonal dips—like the annual decline in January traffic. However, it fails to account for sharp, event-driven spikes around holidays. As a result, the model underpredicts key moments like the expected lift on Valentine’s Day 2025, underscoring the need to include external drivers such as holidays to improve short-term accuracy.
Enhancing the Forecast with Holidays and Ad Spend
To improve the model’s accuracy, the next step is to incorporate holiday events and monthly ad spend—two factors that have shown strong influence on web traffic. By adding these as external predictors, the model can better capture promotional spikes and the lift generated by marketing investment, resulting in a more realistic and actionable forecast.
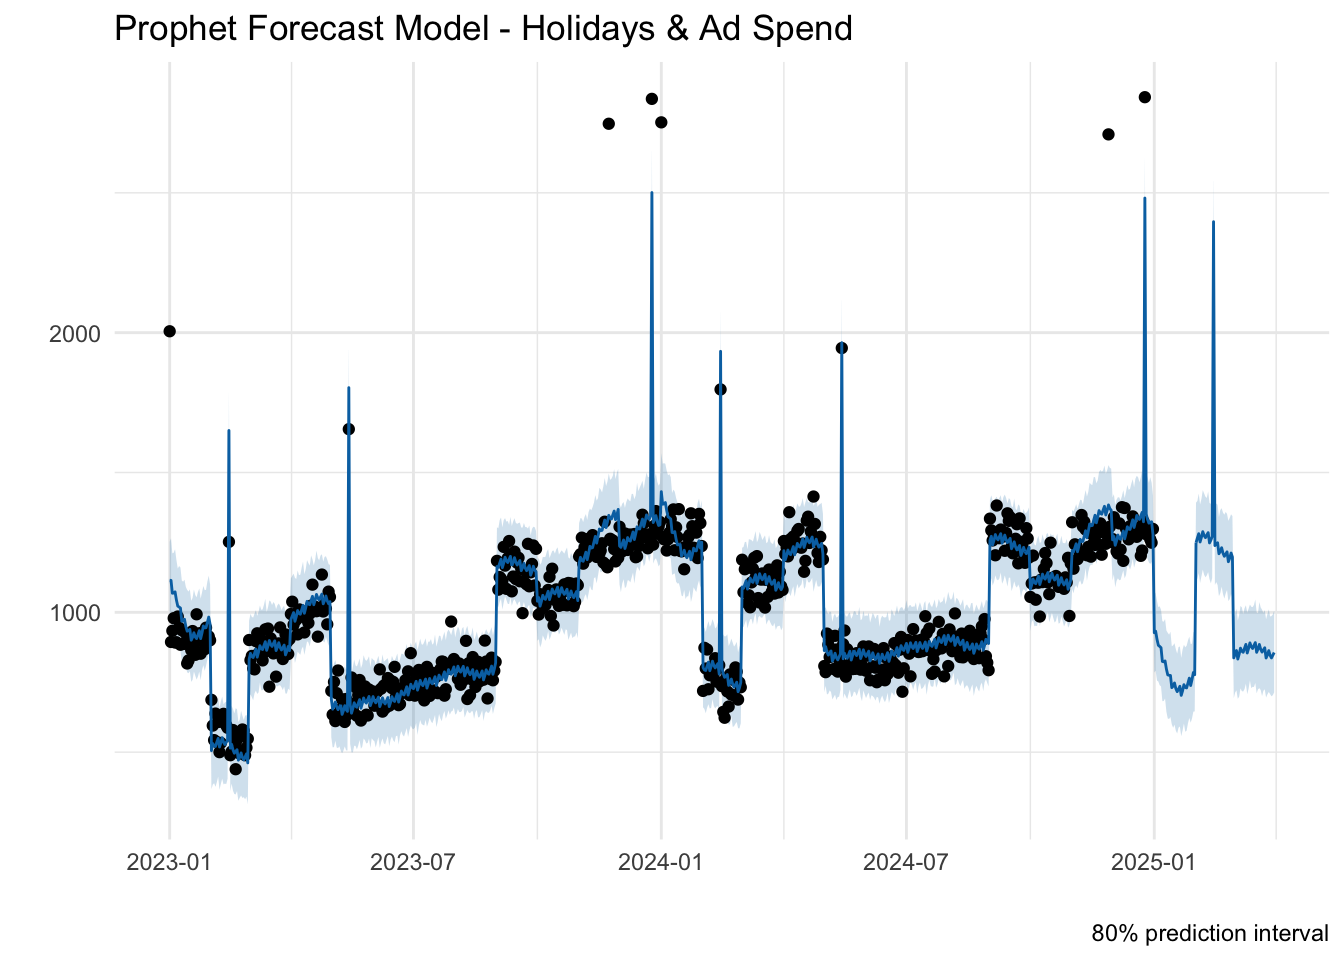
This updated model demonstrates a meaningful improvement over the baseline. It successfully captures sharp spikes in traffic around key holidays—most notably the projected increase for Valentine’s Day—and more accurately reflects patterns influenced by consistent monthly ad spend. By incorporating both seasonal events and marketing investment, the model produces a forecast that better aligns with real-world demand drivers and provides more actionable insight for planning.
Evaluating Forecast Accuracy
While the visual forecasts provide helpful context, it’s difficult to assess which model performs better by sight alone. To compare models objectively, we’ll use cross-validation—a statistical technique that evaluates forecast accuracy by testing each model’s performance on historical data.
Cross-validation is a technique to evaluate how well a model can predict future values by using historical data. It helps determine if a model will generalize well to new, unseen data, which is essential for making accurate forecasts. With respect to time series forecasting, cross-validation preserves the chronological order of observations.
| Model | MAE | RMSE | MAPE |
|---|---|---|---|
| Baseline Prophet | 105.269 | 154.150 | 10.68% |
| Holidays & Ad Spend | 82.836 | 107.618 | 8.39% |
Incorporating holidays and ad spend into the forecast model significantly improved accuracy. The enhanced model reduced the mean absolute error (MAE) by ~22%, the root mean squared error (RMSE) by ~30%, and the mean absolute percentage error (MAPE) from 10.68% to 8.39% compared to the baseline. This highlights the strong predictive value of aligning forecasts with seasonal events and marketing investment.
Conclusion
This demonstration highlights how incorporating marketing inputs into time series forecasting—like ad spend, pricing, and seasonal holidays—can sharpen demand signal accuracy and unlock broader strategic value. Forecasting web traffic isn’t just about measuring digital engagement; it’s about uncovering intent. When modeled thoughtfully, traffic becomes an upstream demand signal—one that connects marketing strategy directly to operational planning.
By using a flexible, driver-based framework in Prophet, demand planners can transform historical behavior and forward-looking assumptions into actionable forecasts. Campaign shifts, price adjustments, and media budget changes are no longer vague variables—they’re quantifiable inputs that shape demand expectations and guide planning decisions. In the context of S&OP, this translates into more meaningful Demand Review conversations, where modeled scenarios bring cross-functional teams onto the same page with data-backed clarity.
Ultimately, this approach reframes the forecast not as a static report, but as a dynamic planning tool—one that links top-of-funnel engagement to downstream KPIs like conversions, order volume, and fulfillment needs. It strengthens collaboration, speeds up alignment, and gives businesses the agility to respond, adapt, and scale. The result? A forecast that doesn’t just project demand—it narrates the story behind it.
No matching items